无需手机号,秒注册,结交更多医械法规同行,享用更多功能,让你轻松玩转社区。
您需要 登录 才可以下载或查看,没有帐号?立即注册
x
In our previous article (Part 1: Prioritizing Risk Management Activities), we described an approach for identifying the design element(s) or process stages(s) to prioritize when conducting a comprehensive risk analysis. This prioritization helps to ensure that the team’s resources and energy are directed toward those areas that will have the greatest impact on device safety. This article focuses on the use of Fault Tree Analysis to ensure that you take a comprehensive view of hazards/failures before jumping into completing an FMEA. Bridging the Gap – What’s wrong with just starting with FMEA?Once you’ve established your priorities, what’s the next step? When given the direction to “Complete the risk analysis of System A,” most teams will pull out their FMEA template and start the process of listing hazards/system elements/process steps (depending on the type of analysis to be performed) and estimating risks. While some teams working with fairly straightforward systems may be able to make the conceptual leap directly to the FMEA template, the structure of an FMEA is typically too constraining to produce a clear and comprehensive assessment of system risks. FMEA templates are great tools for documenting risks, assigning controls, and documenting the verification of those controls; but their structure makes it very difficult to capture the relationships among hazards/causes. As a result, FMEAs are often incomplete and, at the same time, may include redundancies. It can take the patience of an actuary to work through each row of the FMEA (holding the content and implications of all the other rows in your head) to find these gaps in the analysis. To bridge the gap between identifying priorities and documenting risks and controls in an FMEA, we recommend completing a Fault Tree Analysis (FTA). FTAs have several advantages over FMEAs. The most important difference is that FTAs are designed to identify the relationship among the causes of a failure. While each row of an FMEA is independent (i.e., the probability of occurrence for the cause listed on one row has no impact on the causes listed above or below it on the template), the FTA allows you to see both dependent and independent relationships among causes. In addition, the graphical structure of the FTA makes it a very helpful tool for communicating within, and outside, the assessment team. The FTA also provides a good opportunity to consider hazards based on the intended use, reasonably foreseeable misuse, and the characteristics related to safety in both normal and fault conditions. Finally, when the FTA results are transitioned to the FMEA format, the team will have greater confidence that the analysis is comprehensive – allowing them to focus on risk evaluation, control, and verification. FTA – IntroductionThe FTA methodology was developed in the early 1960s by Bell Laboratories to support the development of ICBMs and is often used in reliability engineering and process safety assessments. The key attribute of an FTA is that it allows the analysts to pick a fault (i.e., a hazard/failure) and describe its causes using Boolean logic. “Dependent” causes that must occur in parallel are joined together by “AND” gates (e.g., Failure A will only happen if X, Y, AND Z happen at the same time), and “independent” causes are joined together by “OR” gates (e.g., Failure B can occur if either X, Y OR Z happen). The distinction is very important: if the causes X, Y and Z each have a 10% chance of occurring, Failure A has only a 0.1% chance of occurring (0.1 x 0.1 x 0.1 = 0.001) because all three events must happen. Failure B is much more likely. It is expected to occur 30% of the time (0.1+ 0.1 + 0.1 = 0.3) because any one of the events could trigger the failure. The FTA process forces analysts to think about whether the causes they are assessing are independent or dependent; and it allows them to document the assessment in a format that can be shared and debated with others. These relationships are important to your understanding of the probability that the fault will occur. They are also important to your understanding of how best to mitigate the risk of the failure occurring. For example, since X, Y, and Z must all occur at the same time to cause Failure A, we may only need to place a control on one of these causes to prevent Failure A from occurring. However, since either X, Y, or Z could cause Failure B, controls are needed for each cause. FTA – An Example that we can all relate toTo illustrate the use of FTA (in a non-device, non-proprietary, and hopefully non-controversial manner), we’ve prepared an FTA that analyzes the causes for showing up late for work. Figure 1 provides the structure of the tree.  The top of the tree, Late for Work, is the failure mode of concern (the “Top Fault” in FTA lingo). We have identified three independent causes of showing up late for work: it could be caused by leaving home late, too much traffic, or car trouble. For those who have conducted root cause analyses, you’ll notice that the structure is somewhat similar to an Ishikawa (fishbone) diagram, although those diagrams are designed to identify causes by category (i.e., man, machine, materials, and methods). More importantly, they don’t make use of Boolean logic to show relationships. A better comparison may be a “5 Why” analysis, where the analyst asks, “what was the cause?” five times (or more) to get to the root cause. The tree in our example goes down two to four levels depending on the branch that you follow. So how deep do you go? It’s a bit of a judgment call, but we typically recommend going one step deeper than where you can place a mitigation control. For example, in the “Woke Late” branch, we illustrate going one step below the failure of the alarm. We won’t go into a long description of the tree, because (hopefully) it is self-explanatory. That’s one of the key benefits of the FTA method: it’s very easy to present the results to someone who has not been involved in the analysis and they can quickly understand what you have done and your current understanding of the system. They may not agree with you. They may think you missed something in one branch, should go deeper over here, and went too deep over there; but that’s the objective—creating an analysis that can be shared, assessed, and ultimately agreed upon. Assigning Probability of OccurrenceOnce the structure is agreed upon, the team can use the tree to assess the probability of occurrence for each branch and for the top fault. Figure 2 illustrates how the probabilities can be assigned and assessed. Typically, the analysts will start at the bottom and work their way to the top. In this example, our car-driving commuter works 20 days a month and 250 days each year (he/she must have to work a couple weekends every now and then). Where OR gates are identified, the probability of underlying causes are summed. With AND gates, the causes are multiplied. 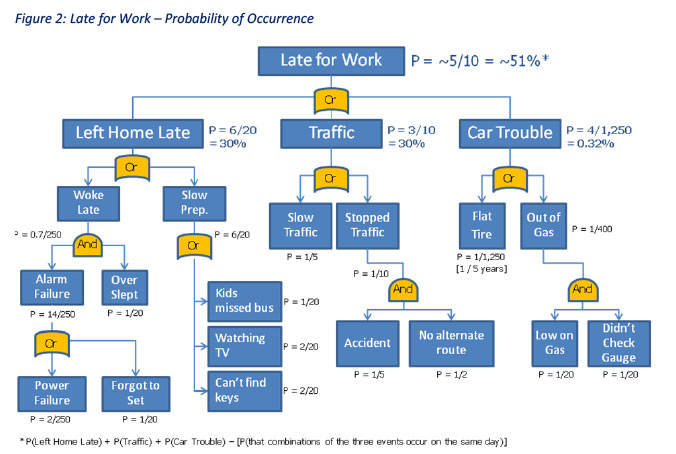 Depending on the system under review, it may be difficult to assign probabilities to each cause. When applied to a medical device, you may have a similar device in your product portfolio on which you can base the assessment. In other cases, there may be industry data that can support your estimate. Lacking either of these types of objective evidence, the team must rely on its members’ collective judgment. They would be wise to establish plans to track device performance during post-production information collection in order to improve the occurrence estimate in the future. Looking back to our example, it appears that our commuter has about a 51 percent chance of showing up to work late each day[1]. If we assume that the severity associated with being late to work is high (e.g., he/she could be fired), implementing risk mitigation controls would appear necessary to reduce the overall risk. Identifying Control OptionsWithout the occurrence estimates, it would be hard to know where to focus our risk control efforts. The occurrence estimates in Figure 2 provide very helpful direction on where to focus our attention. Of the three primary causes (Left Home Late, Traffic, and Car Trouble), Car Trouble contributes a negligible amount to the overall probability of showing up late for work. Figure 3 identifies a set of risk mitigation (control) options that could be implemented to reduce the potential for Car Trouble (e.g., an audible alarm for the gas gauge, preventive maintenance on the tires, etc.). These options may be worth considering if they are not too difficult to implement; but their ultimate impact on the risk of the system failure would be negligible.  Similarly, when you look at the Left Home Late branch, the Woke Late sub-branch is already pretty unlikely, so installing the proposed mitigation of a back-up generator for the alarm clock may not provide a great benefit. However, installing controls that eliminate the potential for getting distracted by the TV and improving the procedure for storing the car keys are more likely to lead to the desired improvement. Finally, the Traffic branch presents some difficult challenges. Here, the causes are further outside the commuter’s control. Short of finding some way to prevent others from having accidents, making better use of your GPS to get around traffic—or simply leaving home earlier to avoid the Slow Traffic—may be the only viable options. For device manufacturers, “leaving home earlier” may be analogous to slowing down the production line or adding an inspection station—both potentially expensive mitigations. Product or process design changes would be a better option. Next StepsWhile the FTA approach provides a clear presentation of the relationship among fault causes, facilitates the calculation of the probability of occurrence, and provides helpful guidance on where controls can be most effective, its structure can become a bit unwieldy. Therefore, analysts will typically transfer the information from the FTA into an FMEA to complete the risk assessment. The FMEA format is more conducive to the orderly tracking of proposed controls and to documenting the verification of effectiveness needed to ensure that all risks have been appropriately addressed and that the residual risks are acceptable to the organization. In our next article, we will describe an approach for transferring information from the FTA to FMEA(s) in a manner that captures the necessary information from the FTA without complicating the FMEA(s).
| 


 发表于 2021-12-22 16:08:22